Memory and CPU Profiling for Rust — A Quick Guide
Overview Profiling is often an important tool to understand the effects of specific components of software on its performance and use of resources. I find it’s important and helpful to profile while developing something — to understand the effects of a specific change — but often its used as a starting point to make optimizations and improvements. Therefore, I’ve put together a practical guide to quickly see how one can profile their rust code.
Note: For these examples, I am using and running Ubuntu 22.04.5 LTS x86_64 with Linux kernel 6.8.0–85-generic. So some steps may not be relevant to other operating systems or Linux distributions.
For all my profiling examples, I’ll be using this simple program I built here:
fn fibonacci(n: u64) -> u64 {
   if n <= 1 {
       return n;
   }
   fibonacci(n - 1) + fibonacci(n - 2)
}
fn bubble_sort(arr: &mut [i32]) {
   let len = arr.len();
   for i in 0..len {
       for j in 0..len - i - 1 {
           if arr[j] > arr[j + 1] {
               arr.swap(j, j + 1);
           }
       }
   }
}
fn string_operations(iterations: usize) -> String {
   let mut result = String::new();
   for i in 0..iterations {
       result.push_str(&format!("Iteration {}, ", i));
   }
   result
}
fn main() {
   // Recursive function (stack heavy)
   println!("Computing Fibonacci...");
   let fib_result = fibonacci(35);
   println!("Fibonacci(35) = {}", fib_result);

   // Sorting (CPU intensive)
   println!("Sorting array...");
   let mut numbers: Vec<i32> = (0..5000).rev().collect();
   bubble_sort(&mut numbers);
   println!("Sorted {} numbers", numbers.len());

   // String allocation (memory heavy)
   println!("String operations...");
   let text = string_operations(100000);
   println!("Generated string with {} characters", text.len());
}
CPU Profiling For Linux, the CPU profiling tools use perf to collect most of the information on function calls etc. Often you can just use perf directly, but there these tools streamline some of the commands, steps and provide nice visualizations to better examine the results with visuals such as flamegraphs. flamegraph
For profiling the CPU usage — I found there is in general better notes and information on doing this for Rust. I have found the flamegraph cargo package to be an easy and effective way to achieve this. Follow the installation instructions on the flamegraph repository — they are already pretty helpful, but here are some helpful notes on additional things to look out for. If you are not running as root, you maybe need to adjust the permissiveness of perf before running, where -1 is the most permissive setting.
sudo sysctl kernel.perf_event_paranoid=-1
The next thing to keep in mind is for rust if you are running a release build, due to optimizations some information will not be available and thus you will not be able to generate a good flamegraph to visualize, so either profile with the debug build or be sure to enabling debugging for your builds while profiling.
[profile.release] debug = true
Then you can run your program as follows, this will by default generate a flamegraph.svg which you can open in your browser to view the results:
cargo flamegraph cargo flamegraph --bin profile_sample
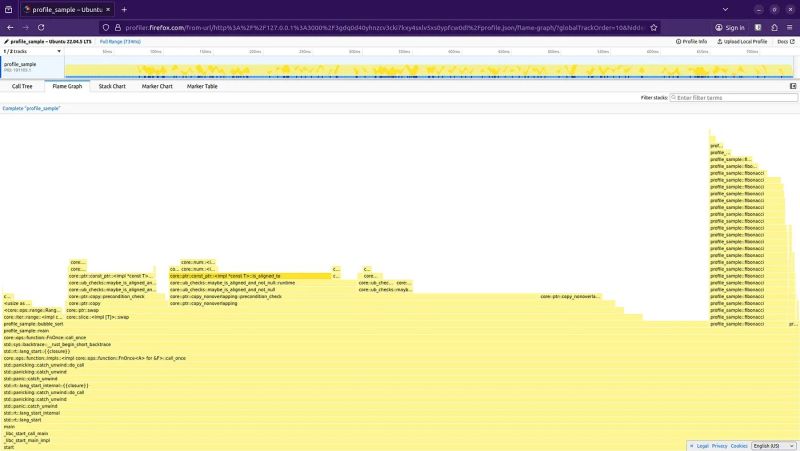
This is a sample of what the output may look like.
Example flamegraph showing what codepaths take the most CPU cycles
samply An alternative is samply — for which install instructions can be found here samply. Which samply, you may also need to adjust the perf settings as stated above, to run:
cargo run --bin profile_sample && samply record ./target/debug/profile_sample
With samply, this will create a server and open a browser window to display the results.
 Visual output from the samply output
Memory Profiling For profiling memory for a rust application, the best package I found was bytehound, the installation is a bit more unclear so here are the steps I took:
- Install package from here, unzip locally, place in a location of your choice. Remember this location, you’ll need it for later.
- Ensure gcc, rust >= 1.62 & yarn is installed
- Build package from the directory where you unzipped the bytehound package, ensure you are in the directory , then run:
Bytehound also has some good docs here you can reference.
cargo build - release -p bytehound-preload
To run the profiler, here are the steps:
export MEMORY_PROFILER_LOG=warn LD_PRELOAD=<path_to_bytehound_build>/libbytehound.so <path_to_target_binary> <path_to_bytehound_build>/bytehound server memory-profiling_*.dat
Example:
export MEMORY_PROFILER_LOG=warn LD_PRELOAD=/home/urban/urban/projects/bytehound-0.11.0/target/release/libbytehound.so ./target/debug/profile_sample /home/urban/urban/projects/bytehound-0.11.0/target/release/bytehound server memory-profiling_*.dat
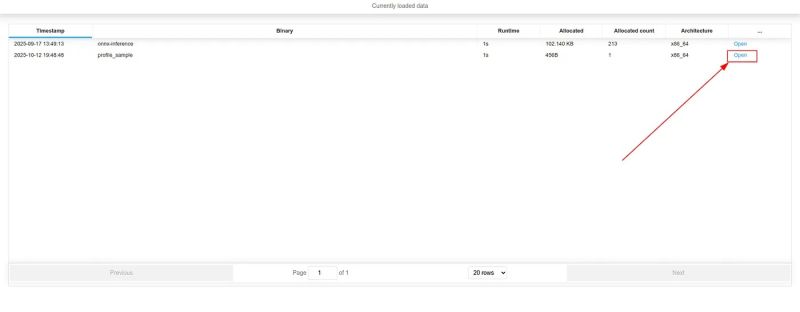
This will open a server interface for all .dat files locally in the current directory, now you can click an open the one of interest to view.
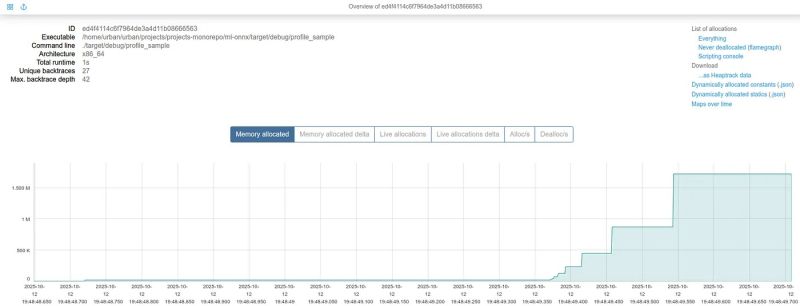
Now you can see the memory profile.
Read the full article here: https://medium.com/towards-data-engineering/memory-and-cpu-profiling-for-rust-a-quick-guide-cb9dd1fb1de2


