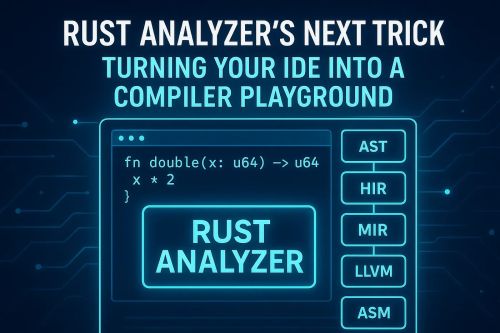
Rust Analyzer’s Next Trick: Turning Your IDE Into a Compiler Playground
Most developers think of Rust Analyzer as the little helper that makes VS Code (or Neovim, JetBrains, etc.) bearable when writing Rust. It’s the thing that:
- Gives you autocomplete.
- Shows inline type hints.
- Lets you jump to definitions.
- Expands macros without tearing your hair out.
It feels like a language server, just like TypeScript’s or Go’s. But here’s the twist: Rust Analyzer is slowly becoming something more dangerous, more experimental, and way more exciting. It’s starting to feel less like an IDE tool… and more like a playground for the Rust compiler itself. Wait, Isn’t Rust Analyzer Just LSP? Technically, yes. Rust Analyzer implements the Language Server Protocol (LSP). Your editor sends JSON-RPC requests like: {
 "method": "textDocument/hover",
 "params": {
   "textDocument": { "uri": "file:///main.rs" },
   "position": { "line": 5, "character": 10 }
 }
} Rust Analyzer replies with structured data about types, docs, or errors. Simple enough. But under the hood, it’s not just parsing your code — it’s actually doing a mini compilation pipeline. Here’s the architecture: Rust Source
  │
  ▼
Parser → HIR (High-level IR) → Type Inference → Diagnostics
                │
         Rust Analyzer Hooks
Rust Analyzer builds its own version of HIR (High-Level Intermediate Representation), parallel to rustc’s. That’s why it’s so damn fast at giving feedback before you even hit cargo build. Where the Magic Starts Because Rust Analyzer has a partial compiler inside it, it can already do things beyond autocomplete. For example:
- Macro expansion previews → See what #[derive(Serialize)] actually generates.
- Type inference exploration → Hover over complex generics and see the compiler’s guess.
- Live errors → Errors flagged before the full compiler runs.
But here’s the exciting bit: the roadmap is pushing it even further — into the realm of interactive compiler experiments. The Next Trick: Compiler Playground in Your IDE Think about what the Rust Playground (play.rust-lang.org) gives you:
- You can paste Rust code.
- Switch between stable, beta, nightly.
- Add compiler flags (-O, -C target-cpu=native).
- View generated assembly or LLVM IR.
Now imagine doing all of that directly inside your IDE, powered by Rust Analyzer. That’s not science fiction. Pieces of this already exist:
- rust-analyzer.view_hir → lets you inspect Rust Analyzer’s internal representation of your code.
- cargo expand integration → shows macro expansions inline.
- Experimental features → view MIR (Mid-level IR) and even LLVM IR for selected functions.
Here’s what it could look like in practice: fn fib(n: u32) -> u32 {
   if n <= 1 {
       n
   } else {
       fib(n - 1) + fib(n - 2)
   }
} Right-click → Show LLVM IR. You’d instantly see something like: define i32 @fib(i32 %n) { entry:
 %cmp = icmp ule i32 %n, 1
 br i1 %cmp, label %base, label %recurse
... } Suddenly your IDE isn’t just hinting types. It’s letting you peek behind the curtain into the compiler’s pipeline. Why This Matters This isn’t just cool nerd candy (though it definitely is). It matters because:
- Learning & Debugging New Rust devs struggle with ownership, lifetimes, and borrow checker errors. If you can see exactly how the compiler desugars your code, you learn faster.
- Performance Engineering Want to know why your hot loop is slow? Instead of guessing, inspect the LLVM IR or assembly inline without switching tools.
- Macros & Metaprogramming Rust macros are famously “black boxy.” A playground view inside Rust Analyzer demystifies what’s actually being generated.
- Research & Compiler Experiments Language researchers can tinker with MIR/HIR, try new optimizations, and immediately test them against real-world code.
Real Reason Rust Analyzer Is Going This Way Here’s the truth: rustc itself is too heavy to run interactively for IDE use. Every time you tweak code, recompiling from scratch would melt your CPU. Rust Analyzer exists because it built a lighter, incremental version of rustc’s frontend. And since it already parses, lowers, and typechecks your code — adding playground-like “views” is a natural next step. It’s not just an IDE thing anymore. It’s turning into a compiler workbench. A Possible Future Architecture Here’s how it might evolve:
          ┌─────────────────────┐
          │   Your IDE (VSCode) │
          └─────────────────────┘
                    │
                    ▼
         ┌─────────────────────┐
         │ Rust Analyzer (LSP) │
         ├─────────────────────┤
         │ Parsing + HIR       │
         │ Type Inference      │
         │ Macro Expansion     │
         │ MIR/LLVM IR Views   │
         └─────────────────────┘
                    │
            ┌───────┴────────┐
            ▼                ▼
        rustc            LLVM Toolchain
  (full compiler)        (optimizations, ASM)
Instead of being a “sidekick” to rustc, Rust Analyzer could become the explorer’s interface into the compiler pipeline. Code Flow in Action Imagine this workflow in VS Code:
- Write a function:
- #[inline(always)] fn double(x: u64) -> u64 { x * 2 }
2. Hover → see MIR lowering:
- bb0: { _0 = _1 * const 2u64; return; }
3. Click → see LLVM IR:
- %0 = shl i64 %x, 1 ret i64 %0
4. Click again → see final assembly for your CPU. That’s not just a linter. That’s a compiler playground wired directly into your dev loop. Emotional Side: Why Devs Care Rust has a reputation for being “hard to learn.” But part of that is because the compiler is a black box that yells cryptic borrow checker errors. Rust Analyzer’s next evolution could turn that black box into a glass box. A place where you can peek inside, experiment, and understand why the compiler behaves the way it does. That’s a huge emotional shift. From frustration → curiosity. From “why won’t this work?” → “oh, so that’s how it works.” Final Take Rust Analyzer started life as a boring IDE helper. Today, it’s morphing into something far more ambitious: an interactive compiler lab sitting in your editor.
- It already does partial compilation and macro expansion.
- It’s heading toward showing MIR, LLVM IR, and assembly.
- The real goal isn’t autocomplete — it’s making the compiler explorable.
That’s not black magic. That’s the future of Rust developer experience.
Read the full article here: https://medium.com/@theopinionatedev/rust-analyzers-next-trick-turning-your-ide-into-a-compiler-playground-608301107f09
